In this tutorial we’ll be creating a circular temperature gauge using Adafruit’s Neopixel LEDs, a Raspberry Pi and components from Monk Makes Starter Kit! No Arduino required! And to make it even more better, we’ll be using Plot.ly to plot the data in real time, turning this little project into an Internet of Things (IoT) sensor! Read on below to get started!
I recently got my hands on some LEDs from Adafruit’s excellent Neopixel range. These brilliant LEDs come in all sorts of shapes, ranging from strips, circular rings to matrices. What makes these LEDs especially great, however, is that they are really, really bright! Unlike ordinary LEDs which have a diffusing cylindrical like cap on the top, these simply have a flat transparent plastic covering. To give you an idea, a brightness level of ~80 out of 255 is the maximum at which you can look at them with your naked eye. The only slight caveat to these LEDs, is that they can only be driven by a dedicated microcontroller like an Arduino board. This meant a Raspberry Pi was out of the question. But thanks to a great library written by Jeremy Garff, it’s now possible to drive them with a Raspberry Pi (and a 5V power supply)!
So what’s this project all about?
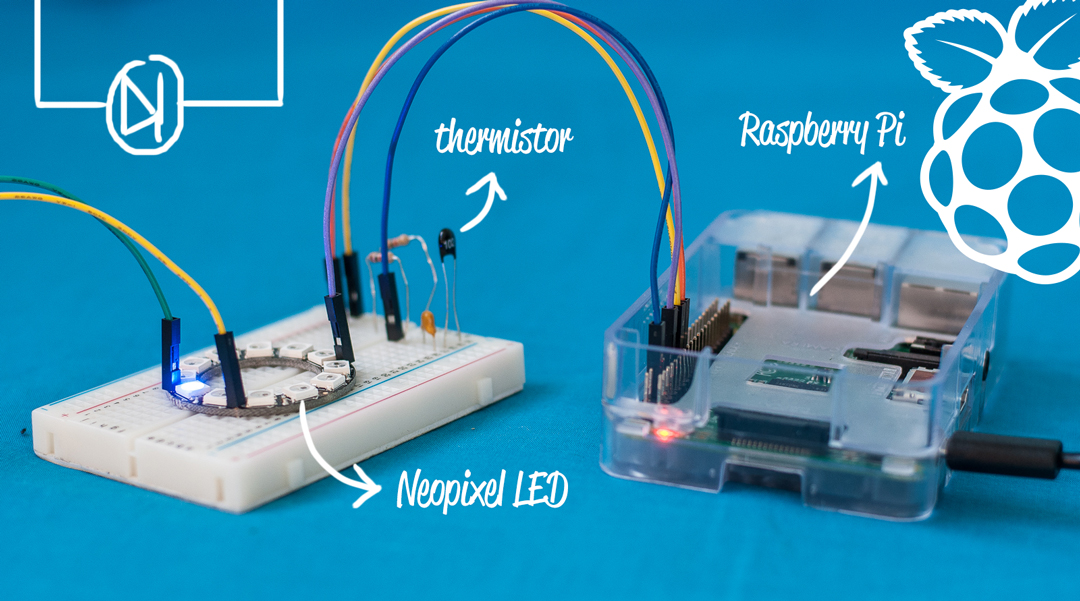
Before we start, let’s explain exactly what we’re trying to do! We’re going to hook up Adafruit’s Neopixel 12 LED ring to a Raspberry Pi, coupled with a temperature sensor. This will allow us to use the LED ring as a circular gauge for the temperature readings. And for those feeling extra ambitious, an extra section will show you how to transmit the readings over the Internet to a real time plotting service (Plot.ly) and allow you to watch the temperature readings from anywhere, so long as you have an internet connection.
So what do we need?
As you probably know, there are many ways to set up a temperature sensor with a Raspberry Pi. In this case, I’ll be using Monk Make’s fantastic Raspberry Pi Starter Kit, which comes with all the components to set up a capacitor-based temperature sensor, including the code that translates the resistance readings to actual temperature values. We’ll obviously also need Adafruit’s Neopixel LED ring, and a 5V power supply to power the LEDs. Although the RPi has a 5V pin, it’s output voltage values do not in fact meet the requirements for the Neopixel LEDs. In my case, I already have an Arduino-based board, so I simply borrowed the pins from that as a power source.
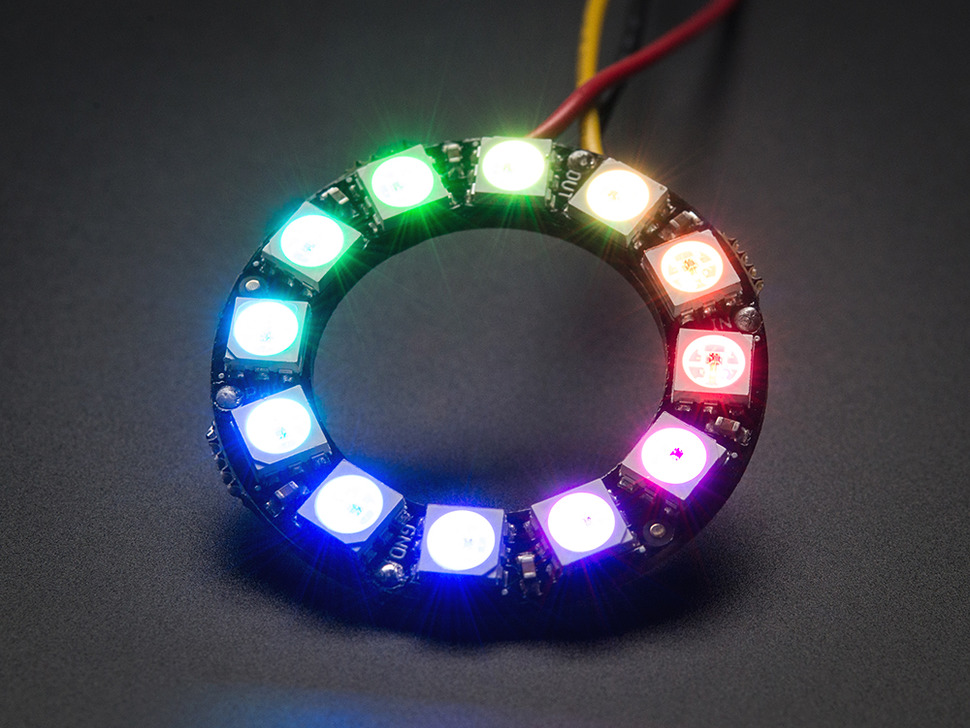
Adafruit’s Neopixel 12 RGB LED. Image from http://www.adafruit.com/product/1643
- Raspberry Pi (currently, the Neopixel LEDs are not compatible with the Pi 2)
- Adafruit Neopixel Ring (12 LEDs)
- 5V power supply (can borrow from an Arduino board)
- Temperature sensor (Monk Makes RPi Starter Kit)
Wiring it all up
Neopixel LED ring wiring
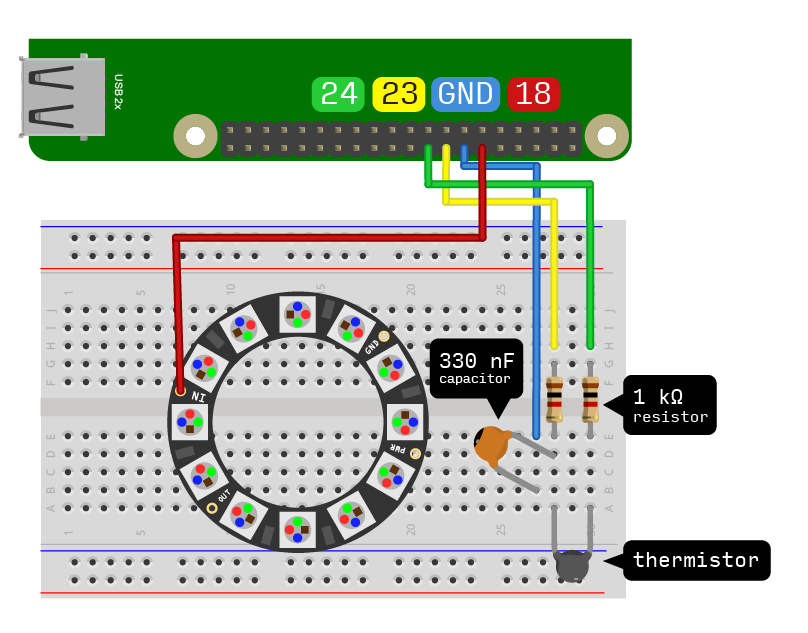
Wiring up the Neopixel ring to the Raspberry Pi is really simple! Simply connect one jumper wire from the ‘IN’ hole on the ring to pin #18 on the RPi GPIO header. This pin is chosen because its the default pin in the RPi Neopixel library. If you change the pin on the RPi, you’ll need to change this in the library you download as well as your Python code. If you’re using the Monk Makes Starter Kit jumper wire (or perhaps any other generic ones), you may find the jumper wires are not as thick as the holes in the Neopixel ring, and hence fall out easily. To circumvent this issue, use the holes on the breadboard to hold the wires in place. The breadboard’s circuit is not actually required for the Neopixel ring, we’re using it simply as a support.
You’ll need another two wires to connect to the ‘PWR’ and ‘GND’ holes on the Neopixel ring, for the power supply. The wire from the ‘PWR’ pin should connect to a +5V power source (positive terminal), and the wire from the ‘GND’ to either a negative terminal or ground pin. If you’re borrowing an Arduino board’s supply, like me, connect to the 5V and GND pins, next to the ADC pins.
Thermistor wiring
If you’re using the Monk Makes Starter Kit, there’s a project card that shows you how to set up the thermistor for temperature readings. We’re using that exact same set up, also shown in the diagram above. If you’re using any other temperature sensor, set it up according to its relevant guides.
Installing the library
Before we can run any Python code, we need to install the necessary libraries. First, download, as a .ZIP, Jeremmy Garff’s rpi_ws281x library from here. You could use a git command to download the repository directly onto the RPi directly, but I found in practice for some reason, the files downloaded this way seem to be corrupted. Before we install the library, you’ll need to install some additional packages on your Raspberry Pi. If your Pi has Internet access, type the following into the terminal:
sudo apt-get update
sudo apt-get install build-essential python-dev scons swig
If you don’t have Internet access, you can search for these packages online and manually dump the packages onto your Pi yourself. You’ll need to make sure the packages for ARMHF architecture. If you’re running Raspbian OS, simply download the Debian packages. Install these packages by typing sudo dpkg -i package.deb at the terminal. The packages listed above have other dependencies (required packages) which are automatically downloaded by the sudo apt-get install command, hence you’ll need to manually install those as well. These dependencies will be listed as errors after the installation fails for one of the packages above.
Important changes to make to the library
The library was written to drive an 8×8 Neopixel matrix, but in our case, we’re working with a 12 LED circular ring. To correct for this, once you’ve downloaded and unzipped the library on your RPi, edit the main.c file. You may use the command sudo nano main.c to edit the file. Around line 56, change the code so it reads as follows:
#define ARRAY_SIZE(stuff) (sizeof(stuff) / sizeof(stuff[0]))

#define TARGET_FREQ WS2811_TARGET_FREQ
#define GPIO_PIN 18
#define DMA 5

#define WIDTH 12
#define HEIGHT 1
#define LED_COUNT (WIDTH * HEIGHT)
The required change involves changing the height to ‘1’ and the width to ’12’, as we’re using a 12 LED strip and not a matrix. The GPIO pin is also defined as 18 by default. Only change this if you’ve wired your Neopixel ring to the RPi differently. Press Ctrl-X to save the file once done. For more information on how this library works, check out Adafruit’s tutorial here.
Compiling the library
Once you’ve installed all the required packages, you’ll need to compile it. From the terminal, cd into the directory containing the unzipped files for the library. Once inside the directory, type scons to compile the library. Next, type cd python to enter the ‘python’ directory, followed by typing sudo python setup.py install. This will install the Python library for you.
The code
You can find the code for this project on my Github page here. Since I’ve based this project around the Monk Makes Starter Kit, the code relies on a separate Python file containing the script to calculate temperature readings from the thermistor (written by Simon Monk / Monk Makes). The main code for the project is written to light up a number of LEDs in proportion to the temperature within the ranges of 0 – 35ºC. Low temperatures (<18ºC) light up as blue, medium temperatures (>18ºC) as green, and high temperatures (>24ºC) as red.
Running the code
To run the code, open the directory containing the Python files for this project and type at the terminal sudo python main.py run. You should begin to get readings in real time on the terminal, as well as see your Neopixel ring light up! I’ve shown a simulation of the set up below, as it takes a few minutes for the temperature to rise significantly and light up all the LEDs.
The Internet of Things!
If you’ve spent any amount of time reading about devices like Raspberry Pi, you will sure have come across the ‘Internet of Things’. This is basically an idea that involves having all our electronic devices connected to the Internet, allowing them to interact together and operate in a more intelligent, and dynamic way. By electronic devices here, we mean not just computers and mobile phones, but home appliances such as heaters, microwaves, fridges, lighting, etc. One of the simplest of such projects involves a temperature sensor streaming its values in real time over the Internet, from which your heating system could, for example, adjust it’s heating accordingly. Of course, an ordinary thermostat can do this very thing, but sharing this information over the Internet offers even more possibilities. An intelligent home automation system could monitor the data and make predictions to which parts of the day require more heating, and by coupling it with motion sensor data in a room, it could potentially make predictions to when activity in a room is a higher and thus may be requiring additional heating.
With our Internet connected Raspberry Pi, we’ll be taking one small step in this direction by making our temperature data available online using the Plot.ly online plotting service! To get started, hop on to http://plot.ly/ and create a free account. Once you’re logged in, click on your username in the upper right corner, and choose ‘Settings’. On this screen, copy down your username, API key, and your two streaming tokens.
Setting up your code for streaming
If you noticed when downloading the code files for this project, there was a third file named config.json. This file is where you’ll need to enter your username, API key, and streaming tokens. On your Pi, open the file in the terminal using the command sudo nano config.json. Copy in your credentials within the speech marks on the respective lines. Save the file once done.
{
    "plotly_streaming_tokens": ["",""],
    "plotly_api_key": "",
    "plotly_username": ""
}
Installing the Plot.ly Python libraries
The final step before we can stream data is to install the Plot.ly Python library. Open terminal, if not already open, and type the following:
sudo apt-get install python-dev
wget https://bitbucket.org/pypa/setuptools/raw/bootstrap/ez_setup.py -O - | sudo python
sudo easy_install -U distribute
sudo apt-get install python-pip
sudo pip install plotly
Run the code!
With the libraries all installed and your config.json file set up, we’re ready to go! Open in terminal, and navigate to the folder where our project script files. This time type sudo python main.py plotly. Within a few seconds, your temperature values will begin streaming online. To view your data, log in to your account on Plot.ly’s website, and you can see your graph in the Workspace tab. Alternatively, the link will be printed in your terminal when you start the script!
I hope you’ve enjoyed this rather long tutorial, and were able to successfully complete it! If you have any problems or suggestions, please drop a comment below!
Pingback: NeoPixel LED Temperature Gauge With Raspberry Pi #piday #raspberrypi @Raspberry_Pi « Adafruit Industries – Makers, hackers, artists, designers and engineers!()
Pingback: Neopixel LED temperature gauge with Raspberry Pi | Raspberry Pi Pod()